SERAPHIM 2.0: new tools for tracking pathogen spread
Summary
When viral genomes are placed in a spatial and temporal context, the resulting phylogenetic trees become a powerful source of information about how a pathogen has moved through landscapes and populations. Continuous phylogeographic inference — implemented widely through BEAST — has become central to molecular epidemiology, used to reconstruct the dispersal history of fast‑evolving pathogens including yellow fever virus, Zika, SARS‑CoV‑2 and many others.
We present SERAPHIM 2.0, a substantially extended version of the open‑source R toolbox first released in 2016, which processes and analyses the output of spatially explicit phylogeographic reconstructions. The new release implements four core capabilities: (i) flexible visualisation of phylogeographic inferences, including time‑sliced HPD uncertainty polygons exportable as shapefiles; (ii) estimation of an extended set of lineage dispersal statistics, including diffusion coefficients and isolation‑by‑distance signal metrics; (iii) several phylogeographic simulators; and (iv) hypothesis‑testing procedures to investigate the impact of environmental factors on dispersal velocity, location and frequency.
A key methodological refinement in this version shifts the recommended summary statistic from dispersal velocity to the diffusion coefficient, which has been shown to be more robust to sampling intensity. Together with the new isolation‑by‑distance metrics, this provides a more reliable framework for comparing how different viruses spread through different landscapes, host populations or vector communities.
The package is openly available on GitHub (https://github.com/sdellicour/seraphim) along with a series of tutorials and example datasets that walk through each analytical procedure, making continuous phylogeographic analysis more accessible to molecular‑epidemiology and surveillance teams.
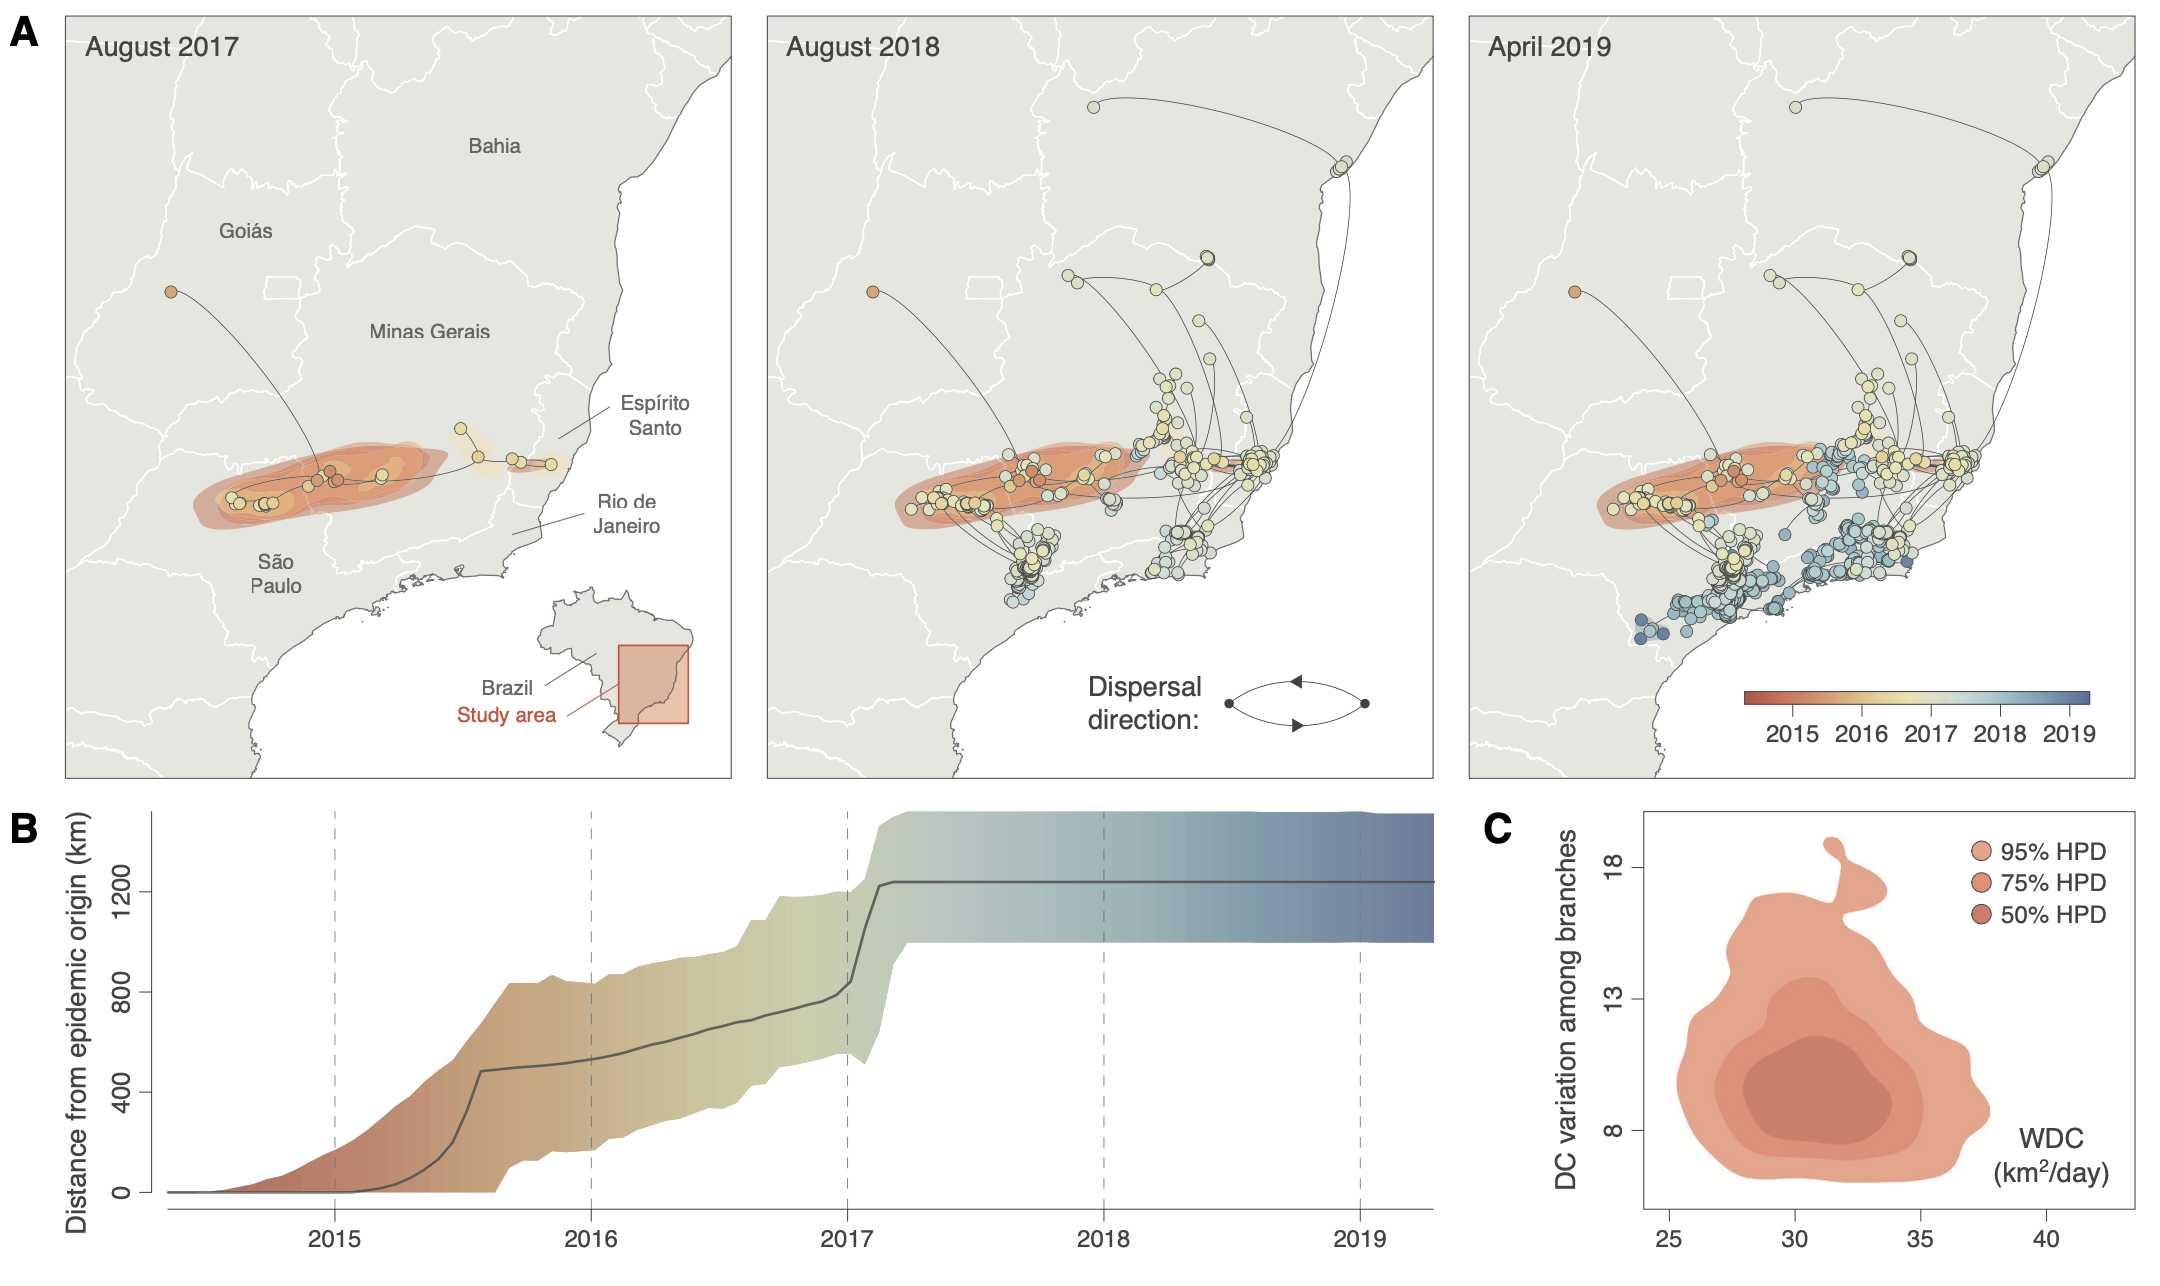
Figure. Example outputs from SERAPHIM 2.0, applied to the 2015 yellow fever virus outbreak in southeastern Brazil. (A) Phylogeographic reconstruction of viral spread: maximum clade credibility tree with 80% HPD uncertainty regions, coloured by time. (B) Maximal wavefront distance from the epidemic origin over time (median and 95% HPD). (C) Diffusion velocity of viral lineages, estimated via the weighted diffusion coefficient (WDC) with 50%, 75% and 95% HPD contours.
Context
Our new open‑access paper in Bioinformatics releases the second major version of SERAPHIM, an R toolbox for analysing how viral lineages move through space and time. Continuous phylogeography — reconstructing where a pathogen's ancestors were, not just when — has become one of the most informative tools available for tracking fast‑evolving outbreaks, but the analytical pipeline that turns BEAST output into interpretable dispersal statistics, environmental hypothesis tests and publishable maps has long required custom code. SERAPHIM 2.0 brings that pipeline together in a single, openly available R package with tutorials.
The update matters for arboviral surveillance specifically: many of the questions DeZi partner labs care about — how fast did this lineage move into a new state?, did deforestation accelerate spread?, do dispersal patterns differ between dengue serotypes or between vector populations? — are precisely the questions SERAPHIM is designed to answer rigorously. By switching the default dispersal statistic to the diffusion coefficient (less sensitive to where samples were collected) and by adding isolation‑by‑distance metrics and environmental hypothesis testing, the toolbox now offers a robust methodological foundation for genomic epidemiology studies.