Climate shapes dengue spread across Indonesia
Abstract
Indonesia has the highest dengue burden in Southeast Asia, with 488 of 514 districts reporting cases annually across its 17,000-island archipelago. Despite this substantial burden, spatiotemporal transmission patterns remain poorly characterised. We analysed province-level dengue surveillance data (2010–2024) from Indonesia’s Ministry of Health alongside local and regional climate variables to characterise heterogeneity in dengue periodicity and identify provinces where climate-based early warning may be feasible.
Using wavelet phase analysis, dynamic time warping clustering, and distributed lag non-linear models, we examined relationships between climate and dengue incidence across 34 provinces. A systematic west-to-east gradient in dengue wave timing was identified, with Northern Sumatran provinces peaking earlier than other provinces, aligning with Australian-Asian monsoon progression. This gradient was robust in western Indonesia (Spearman ρ = 0.7 between longitude and phase lag) but weakened in eastern provinces.
Multi-annual outbreak peaks (2015–2016, 2023–2024) coincided with strong El Niño events, with mean incidence during strong El Niño years was 96% higher than other years. The Indian Ocean Dipole showed no significant association. Phase coherence analysis identified 18 provinces where precipitation-dengue timing was sufficiently consistent (coherence ≥0.85) for potential early warning applications and DLNM confirmed significant dose-response associations in 11 of these.
Indonesia’s dengue-climate relationships exhibit structured heterogeneity that precludes uniform national prediction approaches but may enable province-specific early warning in high-coherence areas. A two-tier system combining ENSO monitoring for strategic preparedness with local climate monitoring for tactical intervention timing could improve outbreak response across Indonesia’s diverse epidemiological landscapes.
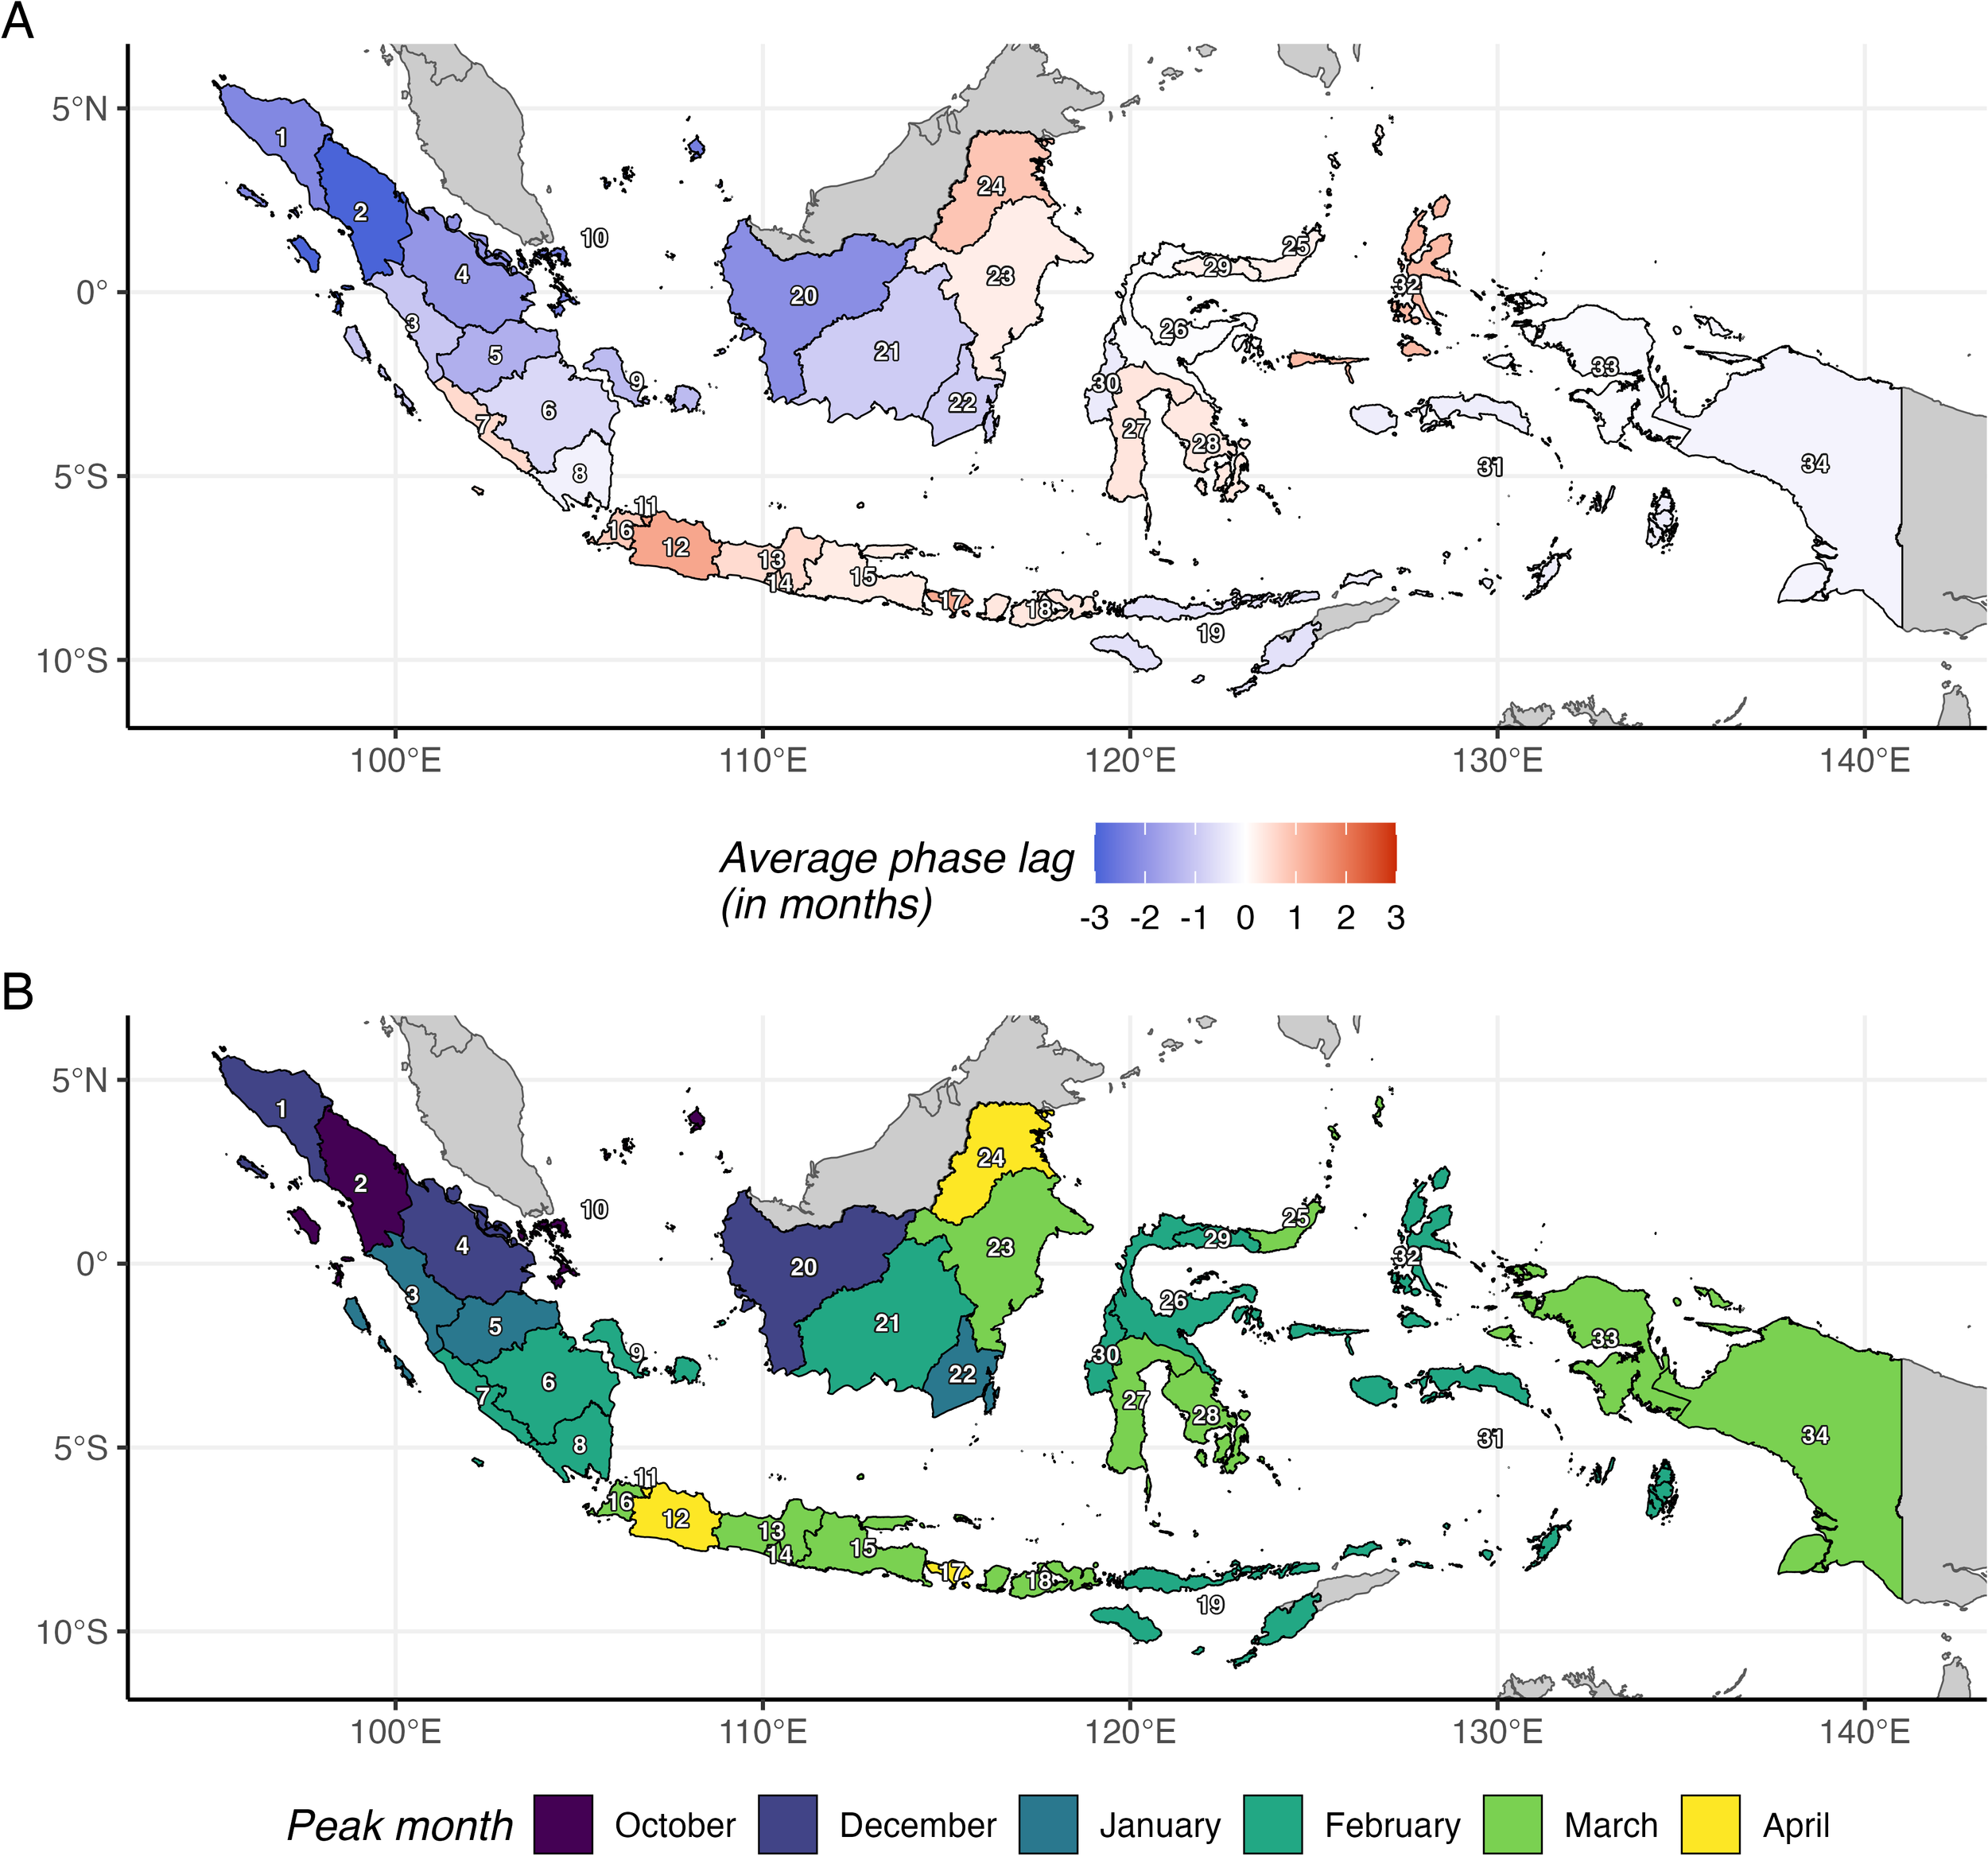
Fig 2. A) Average phase lag (months) of each province’s annual dengue cycle relative to other provinces. Negative values (blue) indicate earlier peaks; positive values (red) indicate later peaks. B) Median peak outbreak month by province, identified using circular statistics over July-June annual periods. Administrative boundaries from geoBoundaries, CC BY 4.0.
Context
Our new open‑access study published in PLOS Neglected Tropical Diseases provides the most comprehensive analysis to date of dengue transmission dynamics across Indonesia’s vast archipelago. Using national surveillance data from 2010 to 2024, combined with climate indicators including rainfall, temperature, and large‑scale climate oscillations, researchers show that dengue epidemics are highly heterogeneous in both space and time.
This work demonstrates that while some regions exhibit consistent climate–dengue relationships suitable for early warning, others do not, highlighting the limitations of uniform national prediction approaches. These findings have direct implications for public‑health planning, supporting the development of locally adapted risk‑assessment tools and more targeted outbreak preparedness strategies. This work closely aligns with DeZi’s mission to integrate epidemiological data, climate science, and modelling to strengthen dengue surveillance and decision‑making.